
This article gives business owners, marketers, and in-house SEO teams a practical method, concrete checks, and an explanation of what the available evidence cannot establish.
Quick Answer
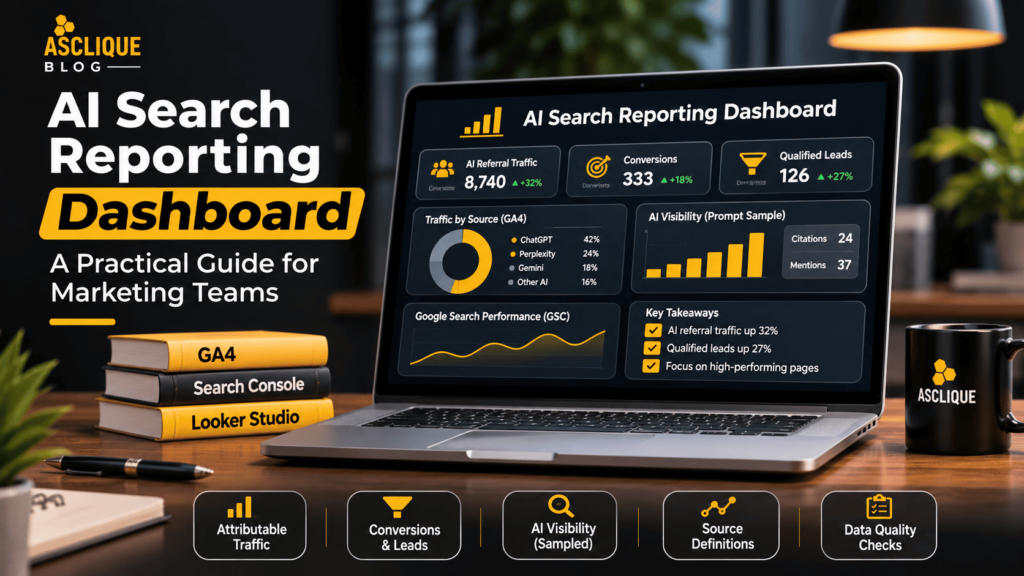
This guide walks through a practical dashboard design with distinct panels, source definitions, quality checks, and stakeholder-ready interpretation.
Key Facts
- Looker Studio can visualize data from connected reporting sources.
- GA4 reports identifiable traffic and configured events, not every assistant mention.
- Search Console reports Google Search performance, not a universal AI visibility score.
- A controlled prompt sample is observational and depends on its test design.
- Metrics with different denominators should not be summed into a single total.
Verified reference points: Google Search Central; Google Analytics Help; Search Console URL Inspection.
Table of Contents
- What Is an AI Search Reporting Dashboard?
- Why an AI Search Dashboard Matters
- How How to Build an AI Search Reporting Dashboard Works – Step by Step
- Tools You Should Use
- Common Errors and How to Fix Them
- Weak Approach vs Better Approach
- Common Mistakes to Avoid
- What Is Not Proven
- How to Measure Success
- Checklist
- Frequently Asked Questions
- Asclique Recommendation
- Need Help With This?
What Is an AI Search Reporting Dashboard?
An AI search reporting dashboard is a collection of views that show attributable AI referrals, business outcomes, and documented assistant-answer observations. Each view should declare its data source and measurement limits.
A useful layout has a traffic panel for GA4, a conversion panel for qualified inquiries, and an observation panel for sampled mentions and citations. Search Console can provide related search context without being mislabeled as cross-platform AI exposure.
The dashboard should answer what changed, whether the measurement process changed, and what action follows. A decorative visibility score without raw counts is less useful.
A comprehensive generative engine optimization strategy can help businesses improve content relevance, strengthen brand information, and evaluate their presence across AI-powered search platforms.
Why an AI Search Dashboard Matters
Marketing leaders need to decide whether to invest in content, fix technical issues, or improve conversion paths. Those decisions require a clear distinction between observed traffic and unobserved exposure.
A dashboard can also expose measurement failures. If referral sessions rise but CRM leads remain flat, the next task may be landing-page analysis rather than more publishing.
Standard definitions make monthly reporting comparable even when the team changes. Without them, different analysts can produce conflicting numbers from the same property.
A strong AI search analytics strategy helps businesses evaluate observable brand mentions, referral traffic, and conversion trends while keeping manually collected visibility data separate from verified website analytics.
Strengthen Your Ai Search Dashboard FoundationReview the specific technical and content decisions that affect this topic, with documented evidence. | Explore SEO Services |
How How to Build an AI Search Reporting Dashboard Works – Step by Step
Step 1: Define the audience and decisions: executives may need qualified leads, while editors need cited URLs and missing answer topics
Define the audience and decisions: executives may need qualified leads, while editors need cited URLs and missing answer topics.
Step 2: List available data sources and document their scope
List available data sources and document their scope. Separate GA4 sessions, CRM opportunities, Search Console search data, and manual prompt observations.
Step 3: Design three panels: attributable traffic, business outcomes, and sampled answer visibility
Design three panels: attributable traffic, business outcomes, and sampled answer visibility. Put units, date ranges, and denominators next to each chart.
Step 4: Connect GA4 and relevant sources to Looker Studio
Connect GA4 and relevant sources to Looker Studio. Use consistent session-scoped dimensions for referral traffic and avoid silently recoding direct sessions.
Understanding how to measure AI-generated traffic in GA4 helps businesses identify referral sessions from AI platforms, evaluate user engagement, and connect traffic data with measurable website conversions.
Step 5: Create a maintained source-filter definition and a separate prompt log
Create a maintained source-filter definition and a separate prompt log. Label manual observations clearly; they are not equivalent to platform-provided impressions.
Step 6: Validate calculations against source interfaces
Validate calculations against source interfaces. Test date controls, filters, duplicate events, and missing values before sharing the report.
Step 7: Add a commentary area with changes, uncertainty, owners, and next actions
Add a commentary area with changes, uncertainty, owners, and next actions. Review the dashboard monthly and version definitions whenever a data source changes.
Professional answer engine optimization services can help businesses improve how website content addresses customer questions and establish a structured process for reviewing AI search visibility.
Tools You Should Use
Businesses can also explore AI visibility tools to monitor brand mentions, track citations, and compare observed visibility across selected AI search platforms. These findings should be reported separately from verified website traffic.
Looker Studio
Create readable scorecards and trend charts with source labels.
Use this tool only for the information it actually provides. Preserve the original export, tested URL, or report settings so the result can be checked after a website or platform update.
GA4
Supply attributable sessions, landing pages, and tested key events.
Use this tool only for the information it actually provides. Preserve the original export, tested URL, or report settings so the result can be checked after a website or platform update.
Search Console
Provide related Google Search performance and indexing context.
Use this tool only for the information it actually provides. Preserve the original export, tested URL, or report settings so the result can be checked after a website or platform update.
CRM
Show whether recorded leads became qualified opportunities.
Use this tool only for the information it actually provides. Preserve the original export, tested URL, or report settings so the result can be checked after a website or platform update.
Prompt observation sheet
Supply manually recorded mentions, citations, and answer accuracy.
Use this tool only for the information it actually provides. Preserve the original export, tested URL, or report settings so the result can be checked after a website or platform update.
Common Errors and How to Fix Them
The following issues have different causes and require different corrective actions. Diagnose the source before changing website content or analytics settings.
Weak Approach vs Better Approach
A better process makes its assumptions visible, preserves evidence, and connects the finding to a clear next action.
Common Mistakes to Avoid
Displaying: Displaying a citation count as if it were platform impressions. Identify the specific page, report, or decision affected before treating this as a priority.
Failing: Failing to label manual versus automatically collected data. Identify the specific page, report, or decision affected before treating this as a priority.
Comparing: Comparing different time windows on adjacent charts. Identify the specific page, report, or decision affected before treating this as a priority.
Ignoring: Ignoring low sample sizes and attribution gaps. Identify the specific page, report, or decision affected before treating this as a priority.
Presenting: Presenting estimated business impact as verified revenue. Identify the specific page, report, or decision affected before treating this as a priority.
Review Your Ai Search Dashboard GapsGet a focused assessment of current implementation, measurement limits, and practical next steps. | Request an Audit |
What Is Not Proven
No dashboard can fully observe cross-platform answer exposure from standard website analytics. A correlation between mentions and leads does not prove that the mentions caused the leads.
At Asclique, we separate documented platform behavior from practitioner observations. Avoid treating an isolated test result as proof of a universal algorithm.
How to Measure Success
Define success in terms of reliable implementation, observable changes, and useful business outcomes. Keep each metric tied to its own source and denominator.
Checklist
- Document the specific business objective and owner.
- Identify the priority pages or customer questions.
- Check official documentation for relevant requirements.
- Verify source information and publication dates.
- Review technical access and indexing where applicable.
- Confirm that visible content supports each important claim.
- Record the testing method and its limitations.
- Check for duplicate or conflicting information.
- Test analytics events before using conversion totals.
- Save baseline evidence before making changes.
- Retest after implementation and record the result.
- Schedule a review after material site or platform changes.
FAQ’s
What should an AI dashboard include?
The answer depends on the scope of AI search dashboard and the source you are measuring. Begin with a clearly defined sample or URL set, then document the exact test conditions. Do not infer results for untested pages or platforms.
Can Looker Studio track ChatGPT mentions directly?
Not automatically. This guide walks through a practical dashboard design with distinct panels, source definitions, quality checks, and stakeholder-ready interpretation. Record the underlying source and compare it with the visible page or original report before deciding what the result means.
How do I report missing referrers?
Use the steps in this guide as a repeatable audit rather than a one-time configuration. Preserve the input, tool settings, date, and output. Recheck after significant changes because an earlier passing test does not verify the current implementation.
Should Search Console be included?
Treat the result as one piece of evidence, not a guarantee. Look for supporting information in the official documentation and in your own measured business outcomes. If the evidence is incomplete, state that limitation rather than filling it with an estimate.
How do I prevent misleading trends?
Choose a metric that directly answers the business question and can be reproduced. Record the numerator, denominator, time window, and data source. Keep observations separate from verified website visits and customer inquiries.
Who should review the dashboard?
Assign an owner and revisit the process after major content, technical, or tracking changes. For ongoing programs, a monthly review can reveal recurring problems. The right cadence depends on how frequently the underlying pages and data change.
Asclique Recommendation
Build a small dashboard that stakeholders can audit. Clearly distinguish measured sessions, qualified outcomes, and controlled observations, then attach decisions to each panel.
Start with the highest-impact pages and a documented baseline. After making changes, retest the same conditions and record what improved, what remained uncertain, and which issue needs a separate investigation.
Combining AI search reporting with professional SEO services helps businesses evaluate organic search performance, identify technical improvements, and connect website visibility with measurable business outcomes.
Need Help With This?
If your team needs help with AI search dashboard, Asclique can review the current setup, identify practical corrections, and establish an evidence-based reporting process. The scope should be agreed before changes are made, particularly where analytics or third-party data access is involved.
Make Ai Search Dashboard ActionableDiscuss a prioritized plan with measurable checks and clear ownership for the next implementation cycle. | Talk to Asclique |